NOTE: This press release was produced and originally distributed by the RE/MAX Network
Home Sales Warm Up With Summer Temps
DENVER (July 14, 2016) – With the market now in the midst of the popular summer selling season, both home sales and prices are rising with the summer temperatures. Homebuyer demand in June kept sales levels above last year’s by 0.7%, with a strong increase of 9.4% over sales in May. The Median Sales Price in June was $229,900, which marks a 2.2% increase over prices seen in June 2015. As year-over-year price increases moderate, there’s a positive impact on home affordability. The number of homes for sale in June fell 15.6% from levels one year ago, making inventory supply a significant challenge, especially in West Coast metros. At the rate of home sales in June, the national Months Supply of Inventory was 3.2, a slight improvement from the 3.0 supply seen in May.
“Last year was the best we’d seen in a long time for home sales. So, it’s encouraging that sales this year are remaining above last year’s levels. Moderating prices are a good thing for this market. Homeowners are still seeing improvement in their equity, while there’s less chance of homebuyers being priced out. We have to wait out the ongoing inventory challenges, but the month-over-month stabilization we’re seeing is a very good sign,” said Dave Liniger, RE/MAX CEO, Chairman of the Board and Co-Founder.
“Nationally, home value increases are well within the healthy range. Although, variances across the country can influence owners’ perception. It’s important for homeowners to realize how they perceive their home’s value could vary widely from how an appraiser views it, since it can make or break a home sale or mortgage refinance,” added Bob Walters, Quicken Loans, Chief Economist.

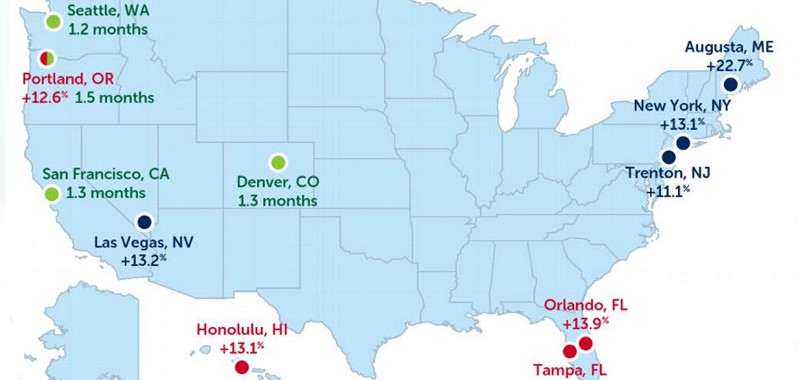
Closed Transactions – Year-over-year change
In the 53 metro areas surveyed in June, the average number of home sales was 0.7% higher than one year ago, and was 9.4% higher than the previous month. Sales are slightly above the strong numbers seen last June and are also above the 6.7% average of month-to-month increases from May to June over the last eight years. Like previous months this year, June home sales continue to be strong in the Northeast. Across the nation, 31 of the 53 metro areas surveyed reported sales higher than one year ago, with six experiencing double-digit increases; Augusta, ME +22.7%, Las Vegas, NV +13.2%, New York, NY +13.1%, Trenton, NJ +11.1%, Cleveland, OH +11.1% and Hartford, CT +10.2%.
Median Sales Price – Median of 53 metro median prices
In June, the median of all 53 metro Median Sales Prices was $229,900, up 3.0% from May, and up 2.2% from the Median Sales Price in June 2015. June is the 53rd consecutive month without a drop in price from the previous year. In 2015, the monthly average of year-over-year price increase was 7.6%. The 2.2% rise in June appears to be signaling a moderation in price increases, which eases pressure on home affordability. Among the 53 metro areas surveyed in June, only four had a year-over-year drop in Median Sales Price. The remaining 49 metros reported higher prices than one year ago, with seven rising by double-digit percentages; Tampa, FL +14.1%, Orlando, FL +13.9%, Honolulu, HI +13.1%, Portland, OR +12.6%, Denver, CO +11.1% Boise, ID +10.1% and Augusta, ME +10.1%.
Days on Market – Average of 53 metro areas
The average Days on Market for all homes sold in June was 54, down 4 days from the average of 58 in both May 2016 and June 2015. June becomes the 39th consecutive month with a Days on Market average of 80 or less. In the three markets with the lowest inventory supply, Seattle, Denver and San Francisco, Days on Market was 25, 23 and 21 respectively. The highest Days on Market averages were seen in Augusta, ME at 143, down from 174 in May, and Des Moines, IA unchanged at 103. Days on Market is the number of days between when a home is first listed in an MLS and a sales contract is signed.
Month’s Supply of Inventory – Average of 53 metro areas
The number of homes for sale in June was just 0.7% lower than in May, but 15.6% lower than in June 2015. Like May, June had a sequential inventory loss of less than 1%. The apparent stabilization of inventory on a month-to-month basis is a positive sign, especially during the summer selling season. Based on the rate of home sales in June, the Months Supply of Inventory was 3.2, which is nearly identical to last month and last year, 3.0 and 3.6 respectively. A 6.0 month supply indicates a market balanced equally between buyers and sellers. The number of metros with a Months Supply of Inventory below 2.0 may also be stabilizing at 8, down from 10 in May. The eight metros with less than a 2-month supply include Seattle, WA 1.2, Denver, CO 1.3, San Francisco, CA 1.3, Portland, OR 1.5, Boston, MA 1.5, Omaha, NE 1.8, Dallas-Ft. Worth, TX 1.9 and San Diego, CA 1.9
About the RE/MAX Network
RE/MAX was founded in 1973 by Dave and Gail Liniger, with an innovative, entrepreneurial culture affording its agents and franchisees the flexibility to operate their businesses with great independence. Over 100,000 agents provide RE/MAX a global reach of nearly 100 countries. Nobody sells more real estate than RE/MAX, when measured by residential transaction sides.
RE/MAX, LLC, one of the world’s leading franchisors of real estate brokerage services, is a wholly-owned subsidiary of RMCO, LLC, which is controlled and managed by RE/MAX Holdings, Inc. (NYSE:RMAX).
With a passion for the communities in which its agents live and work, RE/MAX is proud to have raised more than $150 million for Children’s Miracle Network Hospitals® and other charities.
For more information about RE/MAX, to search home listings or find an agent in your community, please visit www.remax.com. For the latest news about RE/MAX, please visit www.remax.com/
The RE/MAX National Housing Report is distributed each month on or about the 15th. The first Report was distributed in August 2008. The Report is based on MLS data in approximately 53 metropolitan areas, includes all residential property types, and is not annualized. For maximum representation, many of the largest metro areas in the country are represented, and an attempt is made to include at least one metro from each state. Metro area definitions include the specific counties established by the U.S. Government’s Office of Management and Budget, with some exceptions.